HEK cells were stained with Cytotracker red prior to mixing with CHO cells for plating in a 96 well plate. The following day, cells were loaded with ING-2 AM (2011) using our Brilliant Sodium protocol (9000) for 1 h. Images were acquired at 5 minute intervals after the addition of varying ouabain concentrations using both GFP (for ING-2) and Texas Red (for Cytotracker red) filter cubes.
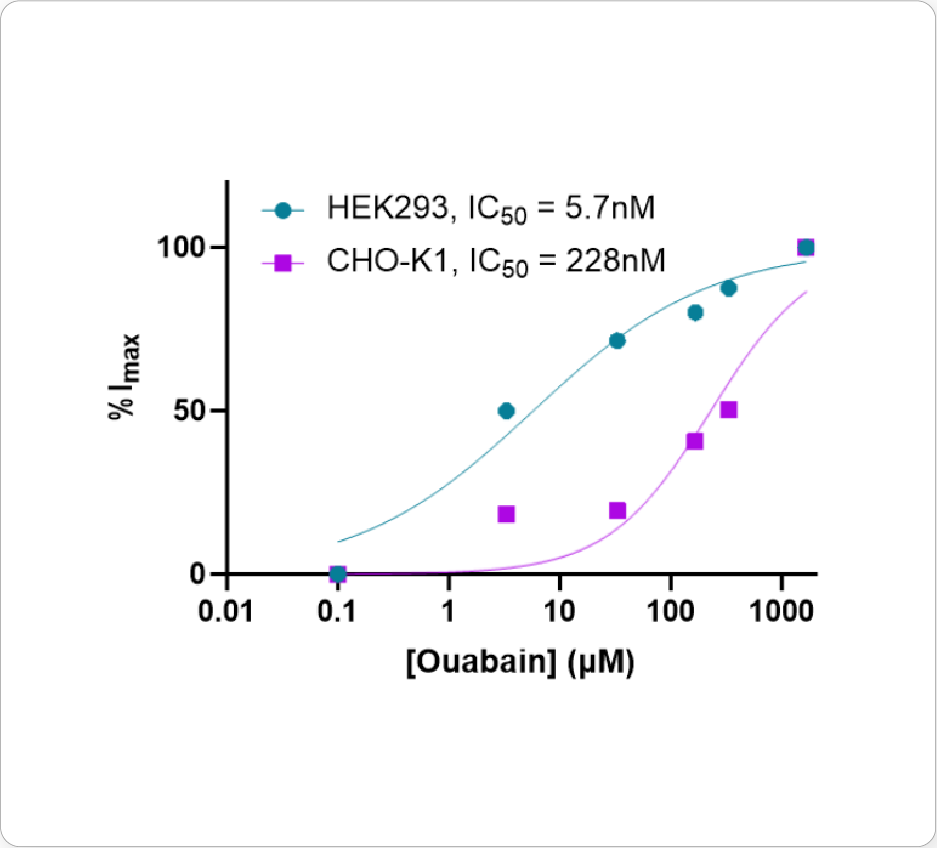
Ouabain is an inhibitor of the sodium/potassium-pump, which uses ATP to transport sodium and potassium against their concentration gradient to maintain a cell’s resting potential. When the pump is blocked, an increase in intracellular sodium is observed that can be measured using ING-2, a fluorescent sodium indicator. Different isoforms of Na+/K+-ATPase are known to have sensitivities to ouabain.
All cells were identified as objects if they fit the following parameters in the GFP channel: Area > 15 um – 100 um, Intensity > 3000 RFUs.
HEK cells were identified in each frame of the video if they fit the following additional parameters: Texas Red intensity > 5000 RFUs. Objects identified as HEK cells are outlined below. These objects are then overlaid onto aligned GFP images for the analysis. The remainder of the cells captured in the GFP mask are qualified as CHO cells.
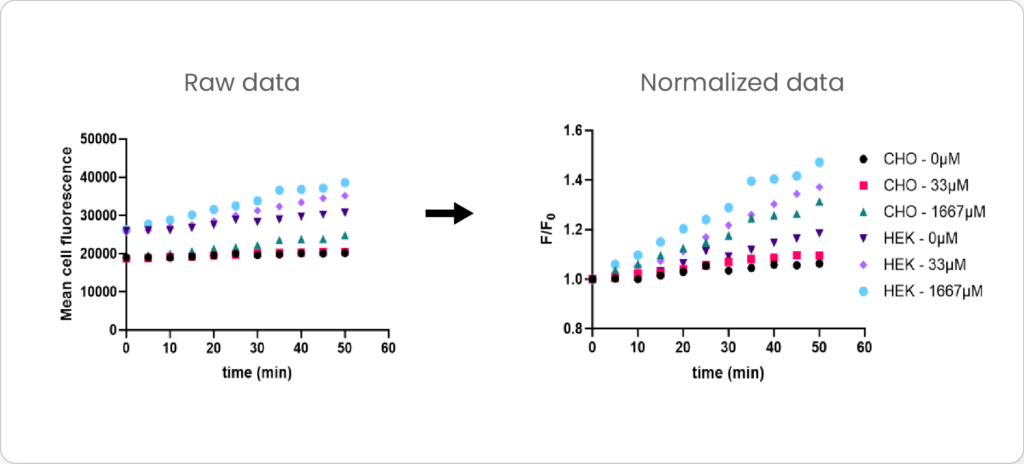
Mean cell fluorescence for each cell population is tracked over time. All data is then normalized to the mean cell fluorescence for that population from the first image, acquired just after the addition of ouabain.
We invite you to explore our website for product specific information and reach out to our experts with any inquiries you may have about which products are most suitable for your needs.